Welcome, Kapamilya! We use cookies to improve your browsing experience. Continuing to use this site means you agree to our use of cookies. Tell me more!
[OPINION] Statistically Speaking: Gen Zs, Millennials underrepresented; 'Boomers' overrepresented in Pulse Asia Feb survey
[OPINION] Statistically Speaking: Gen Zs, Millennials underrepresented; 'Boomers' overrepresented in Pulse Asia Feb survey
Romulo A. Virola
Published Apr 29, 2022 09:24 AM PHT
|
Updated May 02, 2022 08:41 PM PHT
This is a follow up to my attempt to analyze the Pulse Asia (PA) February 18-23 survey, vis-à-vis other data sources. But before I go to the second part of my analysis, I would like to thank a couple of readers who commented on the mismatch between the number of COMELEC registered voters and the population by region, which we talked about in Part I. More specifically, why some regions (7 of the 17 regions) have more registered voters than the voting age population.
One explanation provided was that some voters who reside elsewhere choose to register in their provinces if the “bigayan” there is “malaki”!
Transport cost is fully shouldered by the corrupt, vote-buying candidate or his/her supporters, plus P3,000 per voter in the household! A place in Region 8 ( where the number of registered voters exceeded the voting age population by 8 percent as reported in Part I) was mentioned.
Indeed, is this how low the quality of our voters and our politicians has become? This couldn’t be due to poverty alone, could it? Or could they be taking the money as famously advised by an influencer a long time ago, but would vote according to their conscience anyway?
Another explanation offered is that some voters working or residing in a place different from their birthplace may, for various reasons, opt to register in their birthplace! I think this is allowed under the existing registration rules, although the reason may not be that noble!
ADVERTISEMENT
In either case, it means that the place where one is counted in the list of registered voters is different from the place where he/she is counted in the population census/projections. Hence the mismatch could indeed happen! But of course, padding of the voters’ list could have happened too!
Now for the second part of the analysis, on further assessing the representativeness of the PA sample.
It may be recalled that in Part I, we assessed the comparability of the distribution of the PA sample respondents with the distribution of (1) the voting age population as of July 1, 2021, and (2) the registered voters for the May 2022 elections, across regions. Specifically, we compared the percentage share of each region in the PA sample vs the shares in (1) the PSA voting age population and (2) the registered voters from COMELEC.
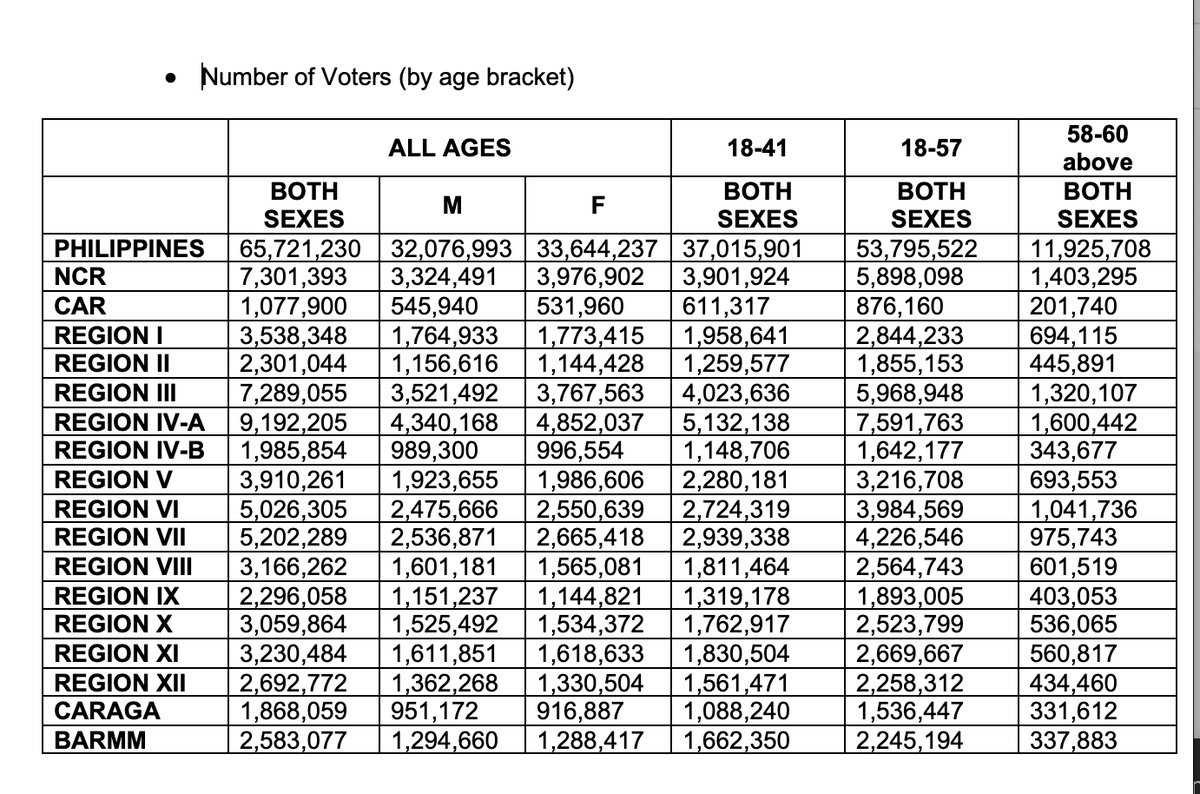
For Part II, we will examine the disaggregation of the PA sample by age, vis-à-vis other data sources. Data used are the age distribution of the PA sample respondents and the age distributions of the PSA voting age Population Projections and charts from the COMELEC about registered voters.
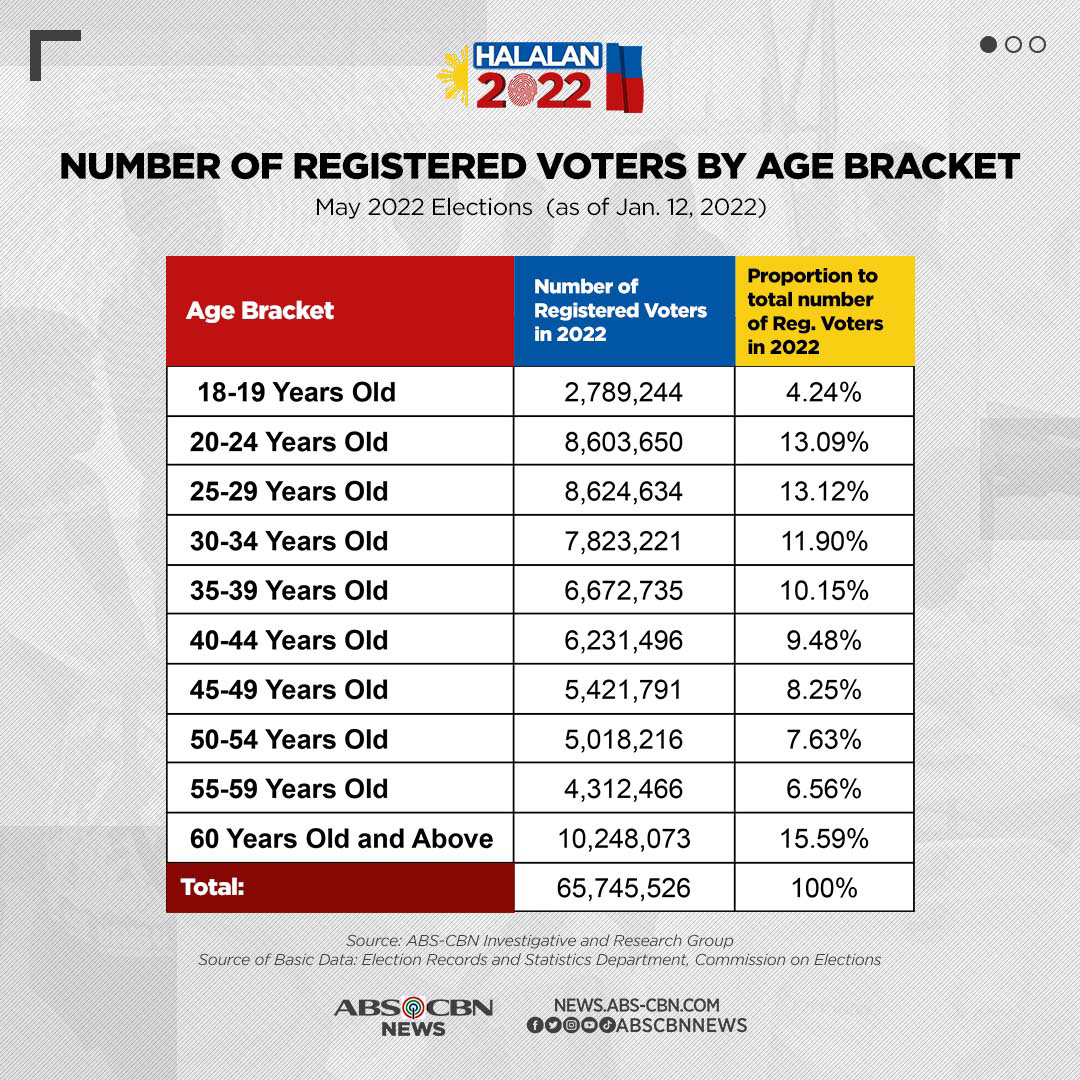
Chart from COMELEC EID
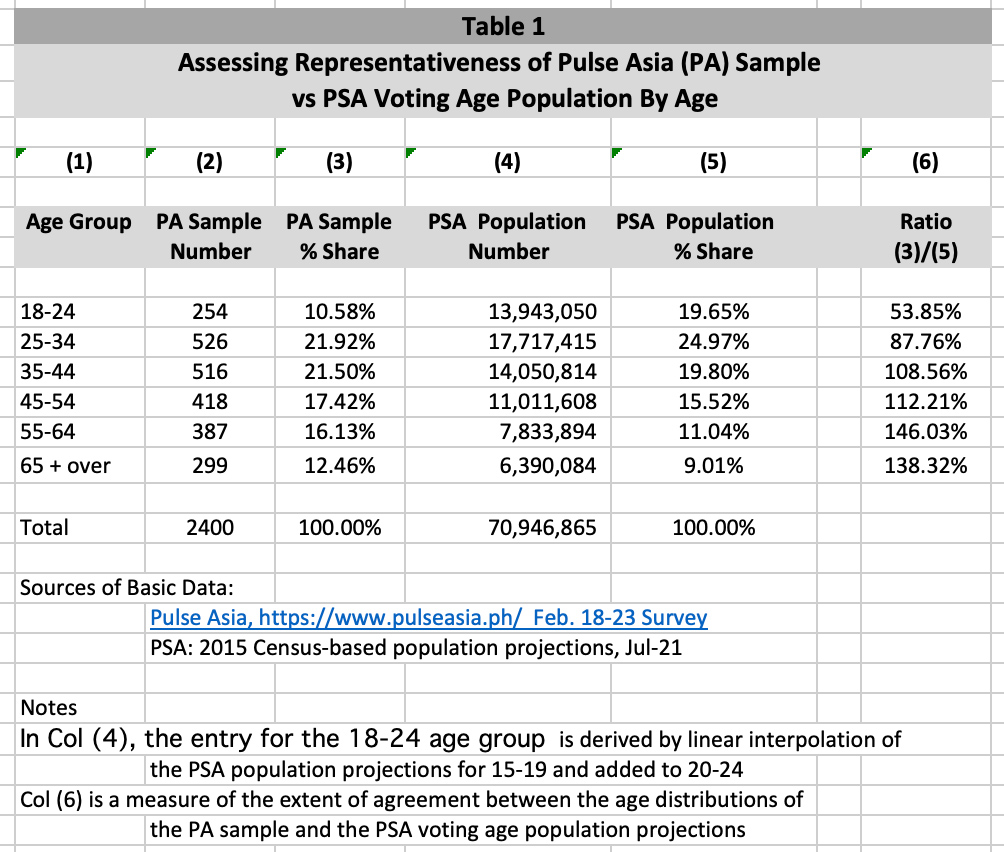
In the Pulse Asia (PA) sample, the younger ages were underrepresented and the older ages overrepresented when compared to the PSA voting age population:
• Specifically, PA underrepresented the 18-24 age group or those born between 1998-2004 by 46 percent; and the 25-34 age group or those born between 1988-1997 by 12 percent.
Why? Could the young, who were born after the EDSA People Power Revolution that restored freedom and democracy to our country, be less cooperative in responding to PA surveys? Come on young guys and girls, if you prefer information to disinformation/ misinformation/ malinformation/ fake news, it is imperative that you invest in knowledge… by honestly responding to statistical surveys!
• Quite heavily overrepresented in the PA sample are the 55-64 age group or those born between 1958-1967 by 46 percent and the 65 or over senior citizens or those born in or after 1957 by 38 percent. I am quite sure though, it is not because the older citizens serve merienda to the PA enumerators while responding to the survey questionnaire!
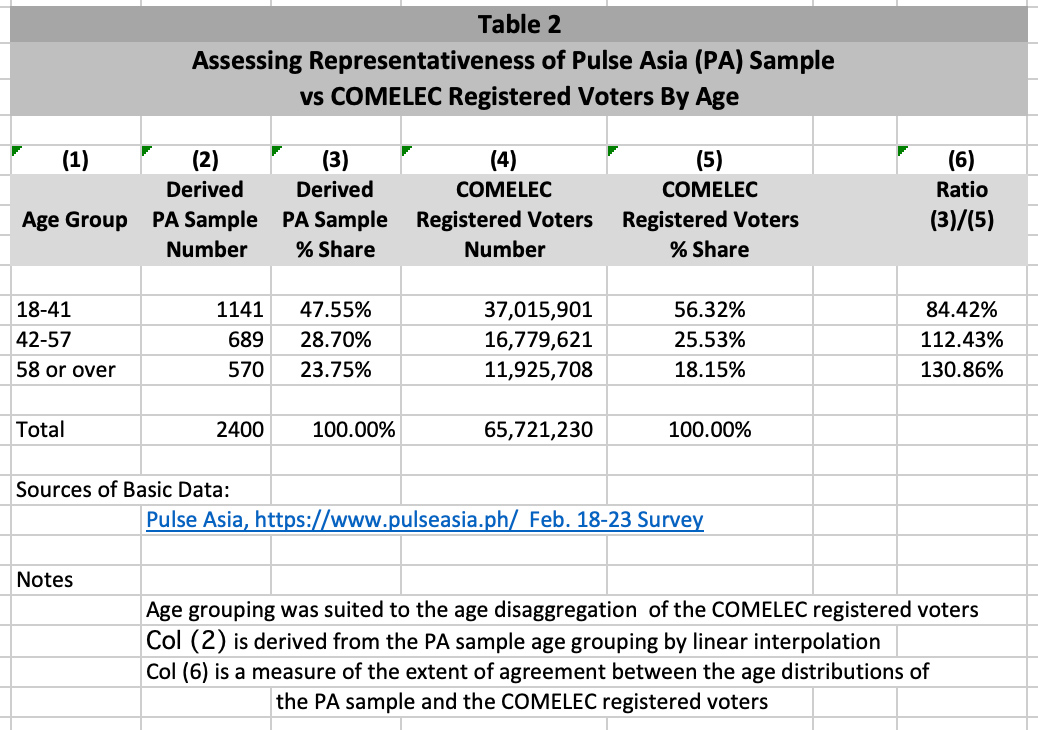
Similar conclusions are observed from comparing the PA sample with the COMELEC registered voters.
• the 18-41 age group or those born between 1981-2004 was underrepresented by 16 percent; and
• the 58 or over age group or those born in or before 1964 was overrepresented by 31 percent.
So, while Part I did not disclose any of what I could consider a serious mismatch between the PA survey and the regional distribution of either the voting age population or the registered voters, our short analysis in Part II about the distribution by age of the PA sample respondents is something else!
And it could very well spring a surprise when the actual results of the May 2022 elections come out if in fact, there is a youth/young vote, and/or many of the older voters would/could not vote due to COVID-19 or for other reasons.
The Pulse Asia 18-23 February survey could be way off! As the popular, colorful and talented Inday Badiday ( may she rest in peace!) used to say, Careful, Careful! And let us hope (against hope?) that no politician will say he/she was cheated!
Reminds us of what happened in the United States in 1936 when the Literary Digest magazine predicted that the Republican candidate, Governor Alfred Landon of Kansas, was likely to be the overwhelming winner against incumbent President Franklin Delano Roosevelt (57 percent vs 43 percent).
Well, Roosevelt convincingly won (62 percent vs 38 percent). Quite a humiliating disaster for survey research in the United States, that also marked the unceremonious demise of the erstwhile popular Literary Digest magazine!
Historically, the Literary Digest had predicted the winner in every US presidential election since 2016. In 1936, it used a sample of 2.4 million people.
On the other hand, George Gallup with a much smaller sample of 50,000 people accurately predicted a Roosevelt victory. (So those of you who arrogantly think you are better than professionally trained survey statisticians and “recommend” the use of a larger sample, better listen to the survey methodology experts!)
Explanations in survey research literature for the Literary Digest faux pas point to sample selection and nonresponse bias caused by, among others, • low response rate (24 percent); • the sampling frame (from telephone directories and automobile registration lists) failed to consider the impact on the election results of the economic difficulties the people faced during the Great Depression; and • inappropriate weighting methods.
But a 1937 poll by Gallup to assess why and how the Literary Digest disaster happened asked about participation in the Literary Digest 1936 poll and concluded [E5] that “it was those who failed to participate in the poll (overwhelmingly supporters of Roosevelt) who were mainly responsible for the faulty prediction”.
So, it may now be relevant to ask…. were any of you Kakampinks polled by Pulse Asia from 18-23 February 2022?
Hopefully, a Part III and IV or V, will be forthcoming. Sorry for the delay… Matanda na po tayo!
Meanwhile, let me appeal to our youth and the young – you, who were referred to by our national hero Dr. Jose P. Rizal in his poem “A la Juventud Filipina” as the “ bella esperanza de la patria” or fair hope of the fatherland! Please make sure you vote on May 9 and vote wisely! For our fatherland!
For our future!
Reactions may be emailed to ravirola@yahoo.com or sent via Facebook.
Endnotes:
Romulo A. Virola is formerly with the Actuarial Research and Development Group of the GSIS, and a former Professorial Lecturer in the Graduate Programs of the Statistical Center/School of Statistics and the Department of Mathematics (now the Institute of Mathematics) of the University of the Philippines . He retired in 2012 as Secretary General of the then National Statistical Coordination Board (NSCB) of the Philippines or NSCB (now part of the Philippine Statistics Authority). He finished his BS (Mathematics) from UP, and MS (Actuarial Mathematics), MA (Statistics), and PhD (Statistics) from the University of Michigan, where he was a Fellow in its Sampling Program for Foreign Statisticians under the late Prof. Leslie Kish, author of the pioneering “Survey Sampling”, considered by many as the bible in the field. He used to write/co-write the Statistically Speaking articles posted on the NSCB website from 2004 until his retirement. The author thanks his former colleagues in the National Statistical System (NSS) of the Philippines particularly from the NSCB, Jay Mendoza of IOM, UN Migration Agency and some FB adviser-friends-former classmates for the assistance and support in sustaining the preparation of posts for the Statistically Speaking v.2.0.
This article was originally published on the author’s Facebook page on April 2, 2022. Since then, Pulse Asia has come out with a new survey on April 6, and the PSA released on March 28 an Updated Projected Mid-Year Population for the Philippines Based on the 2015 POPCEN Results: 2020-2025.
Sources: - PSA, 2015-2025 Population Projections LINK: PSA https://psa.gov.ph/population-and-housing/node/164786 - COMELEC EID - ProQuest, https://www.proquest.com/ Limited online preview of the PDF of "President" Landon and the 1936 Literary Digest Poll: Were Automobile and Telephone Owners to Blame? Lusinchi, Dominic. Social Science History; Durham Vol. 36, Iss. 1, (Spring 2012): 23-54.DOI:10.1017/S014555320001035X
Disclaimer: The views in this blog are those of the blogger and do not necessarily reflect the views of ABS-CBN Corp.
ABS-CBN is the leading media and entertainment company in the Philippines, offering quality content across TV, radio, digital, and film. Committed to public service and promoting Filipino values, ABS-CBN continues to inspire and connect audiences worldwide.
Our website is made possible by displaying online
advertisements to our visitors. Please consider supporting
us by disabling your ad blocker on our website.
Our website is made possible by displaying online
advertisements to our visitors. Please consider supporting
us by disabling your ad blocker on our website.