Statistically Speaking: Some questions on data and surveys for the Halalan 2022 | ABS-CBN


Welcome, Kapamilya! We use cookies to improve your browsing experience. Continuing to use this site means you agree to our use of cookies. Tell me more!
Statistically Speaking: Some questions on data and surveys for the Halalan 2022
Statistically Speaking: Some questions on data and surveys for the Halalan 2022
Romulo A. Virola
Published Apr 26, 2022 05:30 PM PHT
|
Updated May 02, 2022 08:27 PM PHT
It may already be fairly obvious who I will vote for President on 09 May 2022. After some thought and despite some initial doubts, I finalized my decision a few months back. This time I am not voting for the lesser evil. I will vote for the best candidate of them all!
It may already be fairly obvious who I will vote for President on 09 May 2022. After some thought and despite some initial doubts, I finalized my decision a few months back. This time I am not voting for the lesser evil. I will vote for the best candidate of them all!
In the interest of transparency, therefore, my election-related perspectives would almost certainly have some biased inclinations!
In the interest of transparency, therefore, my election-related perspectives would almost certainly have some biased inclinations!
Having said that, let me try to analyze the Pulse Asia (PA) February 18-23 survey, vis-à-vis other data sources as a result of which a number of questions arose.
Having said that, let me try to analyze the Pulse Asia (PA) February 18-23 survey, vis-à-vis other data sources as a result of which a number of questions arose.
1. Assessing the integrity of the list of registered voters vis-à-vis the voting age population at the regional level
1. Assessing the integrity of the list of registered voters vis-à-vis the voting age population at the regional level
ADVERTISEMENT
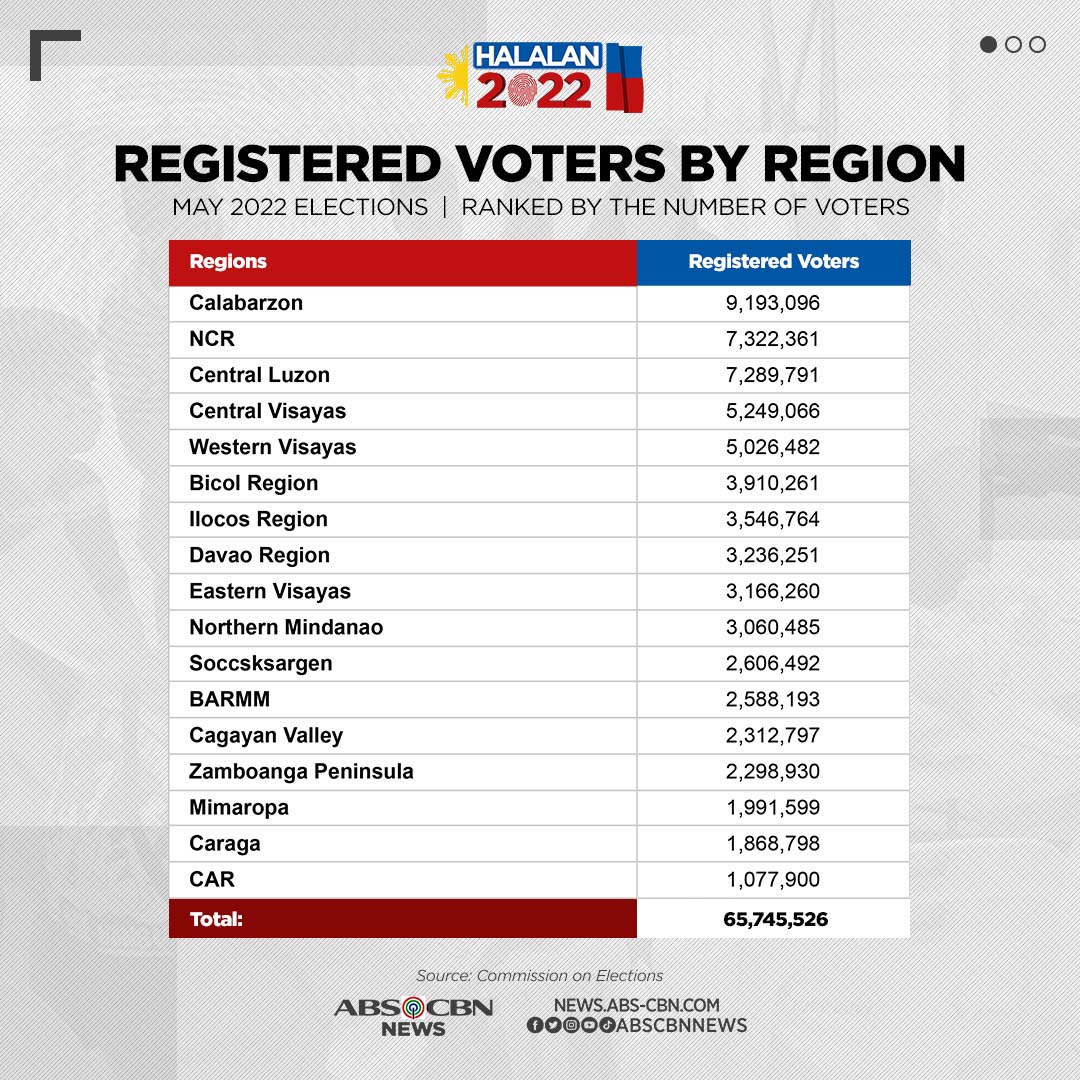
We will do this by comparing the number of registered voters for May 2022 sourced from the COMELEC with the number of voting age population ( i.e. those aged 18 years or over) from the Philippine Statistics Authority (PSA).
We will do this by comparing the number of registered voters for May 2022 sourced from the COMELEC with the number of voting age population ( i.e. those aged 18 years or over) from the Philippine Statistics Authority (PSA).
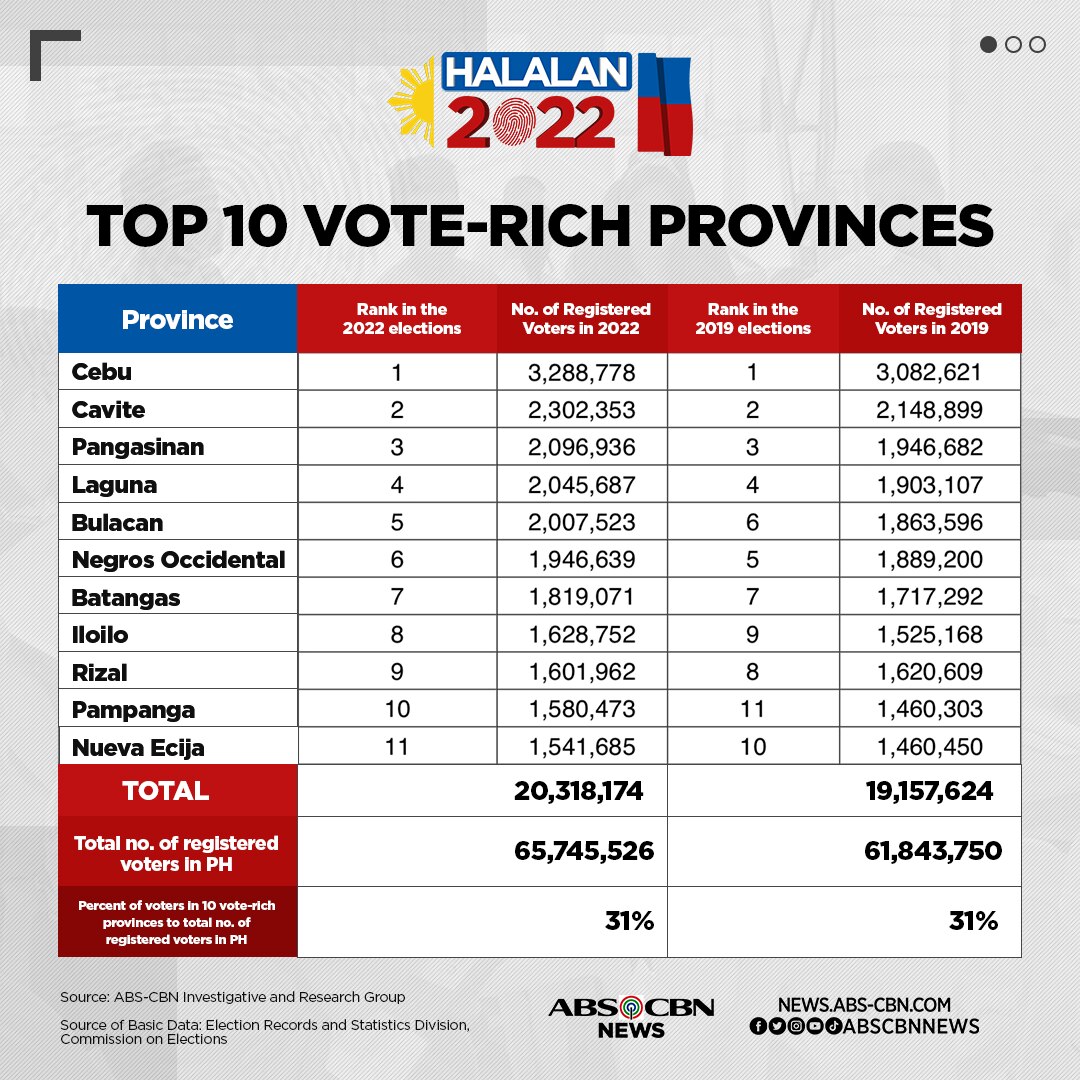
The total number of registered voters for 2022 per COMELEC is 65,745,526 representing historically what might be a big 92.7 percent of the voting age population in July 1, 2021 of 70,946,865.
The total number of registered voters for 2022 per COMELEC is 65,745,526 representing historically what might be a big 92.7 percent of the voting age population in July 1, 2021 of 70,946,865.
Could this mean that we Filipinos are now much more aware of our right of suffrage? Unless what causes the somewhat unusually high voter registration percentage is that something is fishy about the registered voters’ list!
Could this mean that we Filipinos are now much more aware of our right of suffrage? Unless what causes the somewhat unusually high voter registration percentage is that something is fishy about the registered voters’ list!
Now, let us look at the comparison of registered voters and the voting age population by region (Table 1)
Now, let us look at the comparison of registered voters and the voting age population by region (Table 1)
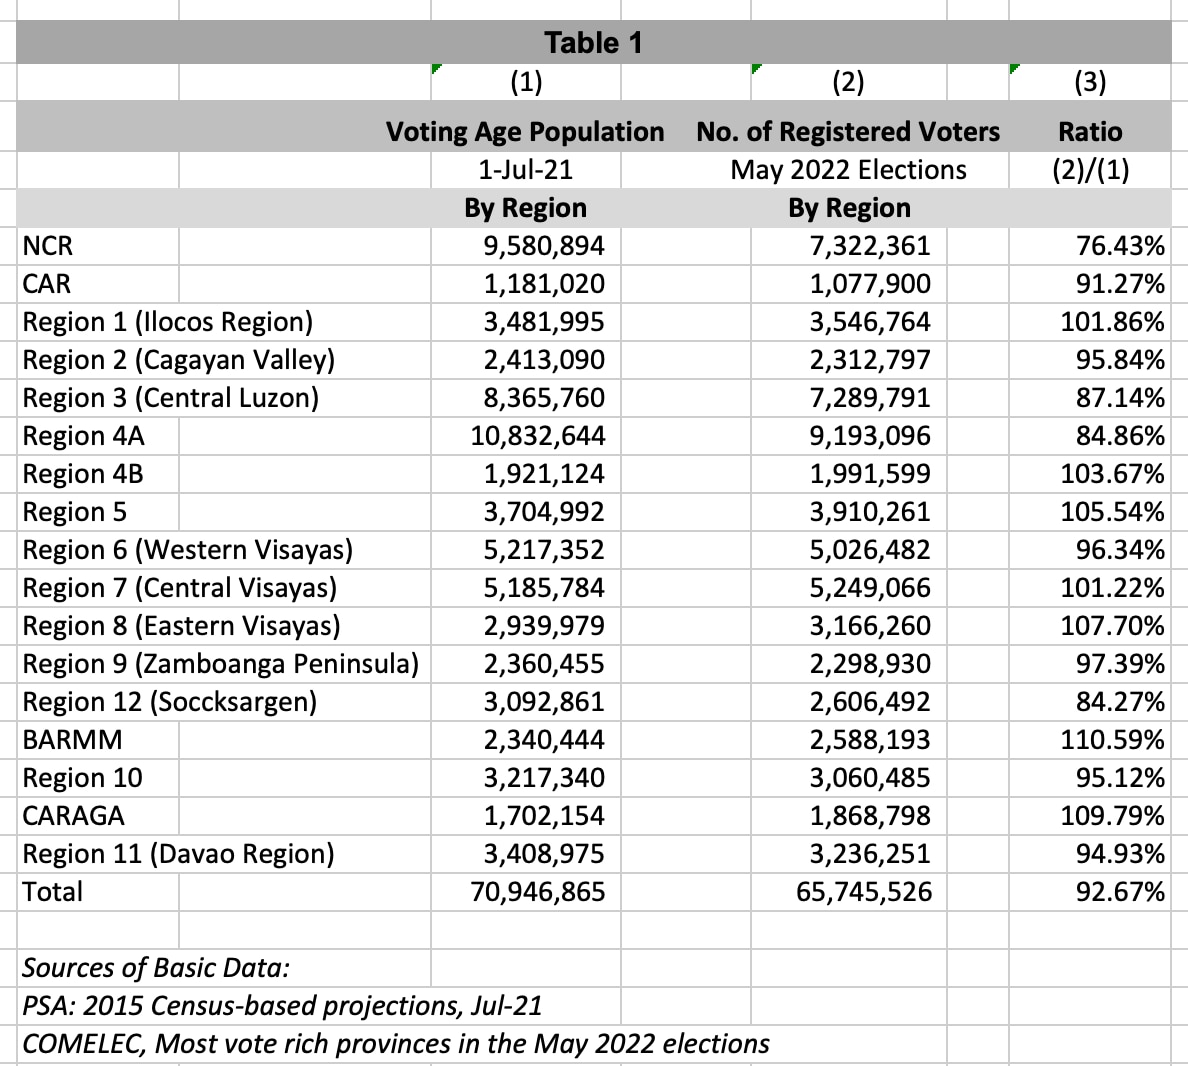
Horror of horrors, in 7 out of the 17 regions, there are more registered voters for May 2022 than the population 18 years or over!!! The percentage of “over-registration” ranged from at least 1 percent to at most 11 percent. How on earth could this have happened?
Horror of horrors, in 7 out of the 17 regions, there are more registered voters for May 2022 than the population 18 years or over!!! The percentage of “over-registration” ranged from at least 1 percent to at most 11 percent. How on earth could this have happened?
ADVERTISEMENT
Obviously, something must be awfully wrong. Either the population projections of the PSA are on the low side, or the COMELEC voters’ list is padded. PSA, COMELEC, please explain? URGENTLY!
Obviously, something must be awfully wrong. Either the population projections of the PSA are on the low side, or the COMELEC voters’ list is padded. PSA, COMELEC, please explain? URGENTLY!
The biggest discrepancies are in BARMM, CARAGA, and Region 8 (Eastern Visayas) where the COMELEC’s voters’ list exceeds the population 18 years or over by 11 percent, 10 percent, and 8 percent, respectively.
The biggest discrepancies are in BARMM, CARAGA, and Region 8 (Eastern Visayas) where the COMELEC’s voters’ list exceeds the population 18 years or over by 11 percent, 10 percent, and 8 percent, respectively.
Other regions where the no. of voters exceeded the population 18 years or over are Regions 5, 4B, 1, and 7.
Other regions where the no. of voters exceeded the population 18 years or over are Regions 5, 4B, 1, and 7.
2. Is the distribution of the PA sample of respondents for its February 18-23 survey comparable to the distribution of the voting age population from the PSA by region?
2. Is the distribution of the PA sample of respondents for its February 18-23 survey comparable to the distribution of the voting age population from the PSA by region?
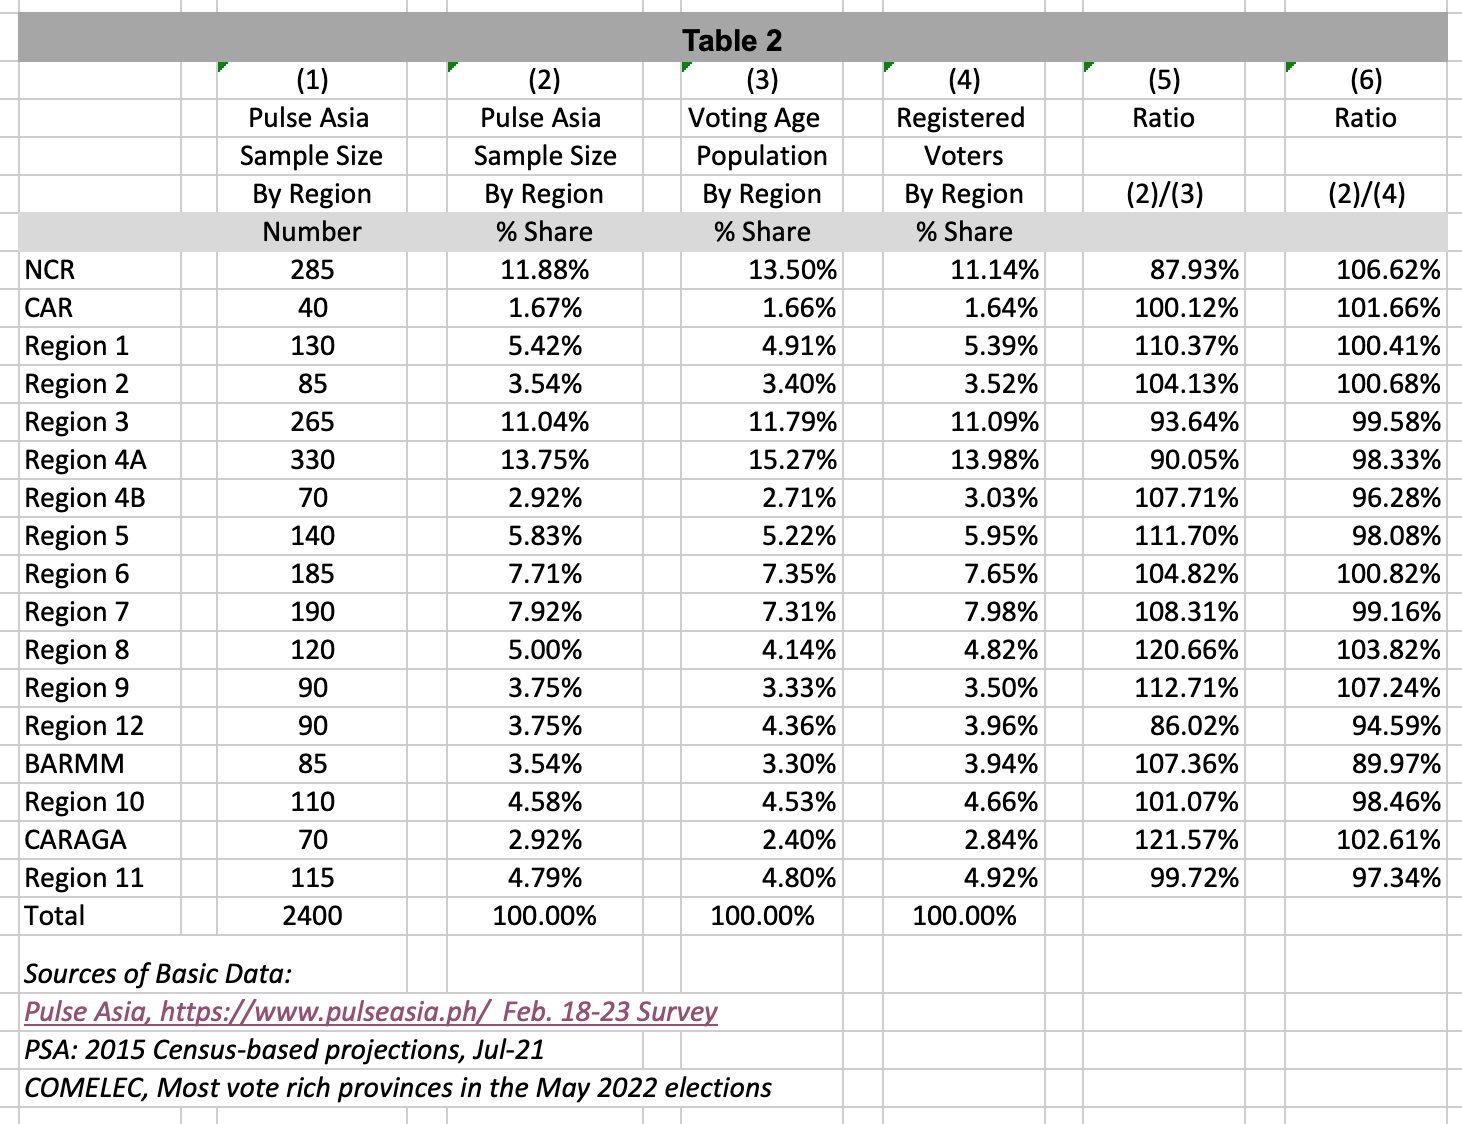
We can see from Table 2 that:
We can see from Table 2 that:
ADVERTISEMENT
The PA sample over-represented the voting age population by at least 10 percent in the following regions: CARAGA (by 22 percent), Region 8 (by 21 percent), Region 9 (by 13 percent) Regions 5 (by 12 percent), and Region 1 (by 10 percent). Among these regions, only Regions 5 and 1 have a voting age population of more than 3 million; while CARAGA with a voting age population of 1.7 million has the second smallest share (2.40 percent) of the total voting age population after CAR. Seven other regions were over-represented.
The PA sample over-represented the voting age population by at least 10 percent in the following regions: CARAGA (by 22 percent), Region 8 (by 21 percent), Region 9 (by 13 percent) Regions 5 (by 12 percent), and Region 1 (by 10 percent). Among these regions, only Regions 5 and 1 have a voting age population of more than 3 million; while CARAGA with a voting age population of 1.7 million has the second smallest share (2.40 percent) of the total voting age population after CAR. Seven other regions were over-represented.
Under-representated by more than 10 percent are NCR (by 12 percent) and Region 12 (by 14 percent).
Under-representated by more than 10 percent are NCR (by 12 percent) and Region 12 (by 14 percent).
Worth noting is the fact that the 3 regions with the largest voting age population namely, Region 4A, NCR, and Region 3 are under-represented, by 10 percent, 12 percent, and 6 percent, respectively.
Worth noting is the fact that the 3 regions with the largest voting age population namely, Region 4A, NCR, and Region 3 are under-represented, by 10 percent, 12 percent, and 6 percent, respectively.
3. Is the distribution of the PA sample of respondents comparable to the distribution of the registered voters from COMELEC by region?
3. Is the distribution of the PA sample of respondents comparable to the distribution of the registered voters from COMELEC by region?
It may be assumed that this is the more appropriate comparison to assess the representativeness of the PA sample. Comparing the distribution of the PA sample respondents with the distribution of COMELEC registered voters, by Region (Table 2),
It may be assumed that this is the more appropriate comparison to assess the representativeness of the PA sample. Comparing the distribution of the PA sample respondents with the distribution of COMELEC registered voters, by Region (Table 2),
ADVERTISEMENT
To me, the extent of over/under-representation by the PA sample of the registered voters per region is nothing serious.
To me, the extent of over/under-representation by the PA sample of the registered voters per region is nothing serious.
Only 8 of the 17 regions were over-represented in the PA sample, and by less than 8 percent: Region 9, NCR, Region 8, CARAGA, CAR, and Regions 6, 2, and 1. Only in Region 9 is the extent of over-representation more than 7 percent
Only 8 of the 17 regions were over-represented in the PA sample, and by less than 8 percent: Region 9, NCR, Region 8, CARAGA, CAR, and Regions 6, 2, and 1. Only in Region 9 is the extent of over-representation more than 7 percent
For all the other regions, the extent of under-representation is not more than 5 percent except for Region 12 (5.4 percent), and BARMM (10 percent).
For all the other regions, the extent of under-representation is not more than 5 percent except for Region 12 (5.4 percent), and BARMM (10 percent).
For the three regions with the largest number of registered voters, NCR is over-represented by 6.6 percent while Regions 4A and 3 were under-represented by 1.7 percent and 0.4 percent, respectively.
For the three regions with the largest number of registered voters, NCR is over-represented by 6.6 percent while Regions 4A and 3 were under-represented by 1.7 percent and 0.4 percent, respectively.
Moreover, I would like to point out that with a sample size of 2,400 to represent the 70.9 million voting population or the 65.7 million registered voters of the Philippines, the discrepancies are not at all unexpected. Nor do I consider them very serious!
Moreover, I would like to point out that with a sample size of 2,400 to represent the 70.9 million voting population or the 65.7 million registered voters of the Philippines, the discrepancies are not at all unexpected. Nor do I consider them very serious!
ADVERTISEMENT
I am sure the PA statisticians know how to handle these discrepancies in their estimation! However, if the race gets closer as the election day nears, the question is whether these discrepancies, even if small, are enough to make the sample not truly representative of those who will vote this coming May!
I am sure the PA statisticians know how to handle these discrepancies in their estimation! However, if the race gets closer as the election day nears, the question is whether these discrepancies, even if small, are enough to make the sample not truly representative of those who will vote this coming May!
Maybe the bigger question mark is the possibility of evil but successful infiltration of the PA sample by trolls, which can contribute significantly to systematic non-sampling errors! And the possibility that indeed, the voters’ list has been padded.
Maybe the bigger question mark is the possibility of evil but successful infiltration of the PA sample by trolls, which can contribute significantly to systematic non-sampling errors! And the possibility that indeed, the voters’ list has been padded.
In summary, dear friends, here are the main questions for Part I:
In summary, dear friends, here are the main questions for Part I:
1. Why doesn’t the COMELEC upload on its website the latest figures on the registered voters for May 2022 disaggregated by region and by age group, at the very least? In accordance with the Freedom of Information principles!
1. Why doesn’t the COMELEC upload on its website the latest figures on the registered voters for May 2022 disaggregated by region and by age group, at the very least? In accordance with the Freedom of Information principles!
2. With the ratio of registered voters for the May 2022 elections to the total voting age population estimated at 92.7 percent, could the voters’ list have been padded with the dead and flying voters? And why oh why would there be more registered voters than the populations 18 years or over in 7 out of the 17 regions!
2. With the ratio of registered voters for the May 2022 elections to the total voting age population estimated at 92.7 percent, could the voters’ list have been padded with the dead and flying voters? And why oh why would there be more registered voters than the populations 18 years or over in 7 out of the 17 regions!
ADVERTISEMENT
3. How accurate are the population projections of the PSA based on the 2015 Census of Population. Could error in the PSA population projections be the reason for the anomaly cited in the second question?
3. How accurate are the population projections of the PSA based on the 2015 Census of Population. Could error in the PSA population projections be the reason for the anomaly cited in the second question?
Let us hope the institutions concerned will respond to these questions! For their own survival, they should, shouldn't they?!
Let us hope the institutions concerned will respond to these questions! For their own survival, they should, shouldn't they?!
Meanwhile, let us call on the COMELEC officials and employees and computer operators/technicians/tabulators for the May 2022 elections to be as professional, as vigilant, as patriotic, and as brave as the "Marvelous 35" heroes--the National Computer Center employees who walked out of the National Tabulation Center during the 1986 snap presidential elections when they thought that the Ferdinand Marcos supporters were trying to cheat and steal the elections!
Meanwhile, let us call on the COMELEC officials and employees and computer operators/technicians/tabulators for the May 2022 elections to be as professional, as vigilant, as patriotic, and as brave as the "Marvelous 35" heroes--the National Computer Center employees who walked out of the National Tabulation Center during the 1986 snap presidential elections when they thought that the Ferdinand Marcos supporters were trying to cheat and steal the elections!
Manindigan para sa rating bayan!!!
Manindigan para sa rating bayan!!!
Notes:
Romulo A. Virola is formerly with the Actuarial Research and Development Group of the GSIS, and a former Professorial Lecturer in the Graduate Programs of the Statistical Center/School of Statistics and the Department of Mathematics (now the Institute of Mathematics) of the University of the Philippines . He retired in 2012 as Secretary General of the then National Statistical Coordination Board (NSCB) of the Philippines or NSCB (now part of the Philippine Statistics Authority). He finished his BS (Mathematics) from UP, and MS (Actuarial Mathematics), MA (Statistics), and PhD (Statistics) from the University of Michigan, where he was a Fellow in its Sampling Program for Foreign Statisticians under the late Prof. Leslie Kish, author of the pioneering “Survey Sampling”, considered by many as the bible in the field. He used to write/co-write the Statistically Speaking articles posted on the NSCB website from 2004 until his retirement. The author thanks his former colleagues in the National Statistical System (NSS) of the Philippines particularly from the NSCB, Jay Mendoza of IOM, UN Migration Agency and some FB adviser-friends-former classmates for the assistance and support in sustaining the preparation of posts for the Statistically Speaking v.2.0.
ADVERTISEMENT
This article was originally published on the author’s Facebook page on March 24, 2022. Since then, Pulse Asia has come out with a new survey on April 6, and the PSA relased on March 28 an Updated Projected Mid-Year Population for the Philippines Based on the 2015 POPCEN Results: 2020-2025.
This article was originally published on the author’s Facebook page on March 24, 2022. Since then, Pulse Asia has come out with a new survey on April 6, and the PSA relased on March 28 an Updated Projected Mid-Year Population for the Philippines Based on the 2015 POPCEN Results: 2020-2025.
Sources:
https://psa.gov.ph/content/updated-projected-mid-year-population-philippines-2020-2025
https://psa.gov.ph/population-and-housing/node/166426
https://www.pulseasia.ph/february-2022-nationwide-survey-on-the-may-2022-elections/
RELATED STORIES
Disclaimer: The views in this blog are those of the blogger and do not necessarily reflect the views of ABS-CBN Corp.
Read More:
voter registration
COMELEC
Philippine Statistics Authority
PSA
Halalan 2022
Eleksyon 2022
elections
May polls
over-registration
under-registration
ADVERTISEMENT
ADVERTISEMENT