Welcome, Kapamilya! We use cookies to improve your browsing experience. Continuing to use this site means you agree to our use of cookies. Tell me more!
Dissecting Data: What 2019 Regional GDP tells us about the pandemic, PH economic resilience
Dissecting Data: What 2019 Regional GDP tells us about the pandemic, PH economic resilience
Warren de Guzman and Edson Guido,
ABS-CBN News
Published Oct 23, 2020 04:00 PM PHT
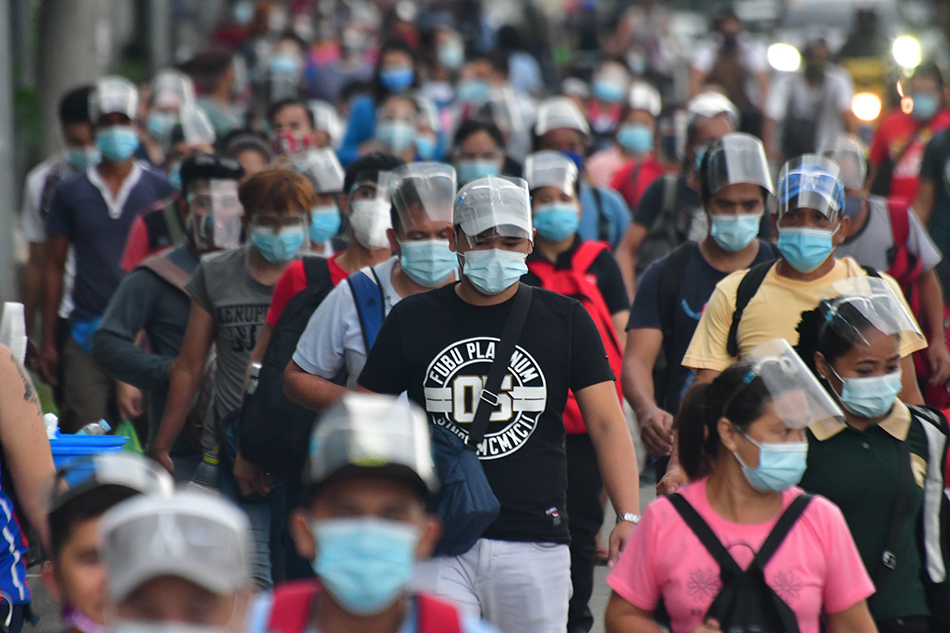
Commuters head to the relcoated bus loading and unloading area along Agham Road in Quezon City on October 15, 2020. Mark Demayo, ABS-CBN News/File
MANILA - The Philippine Statistics Authority released this week the breakdown of gross regional domestic product. It always comes late, due to the work needed to disaggregate all of the data compiled for the national accounts, but the information is still very useful.
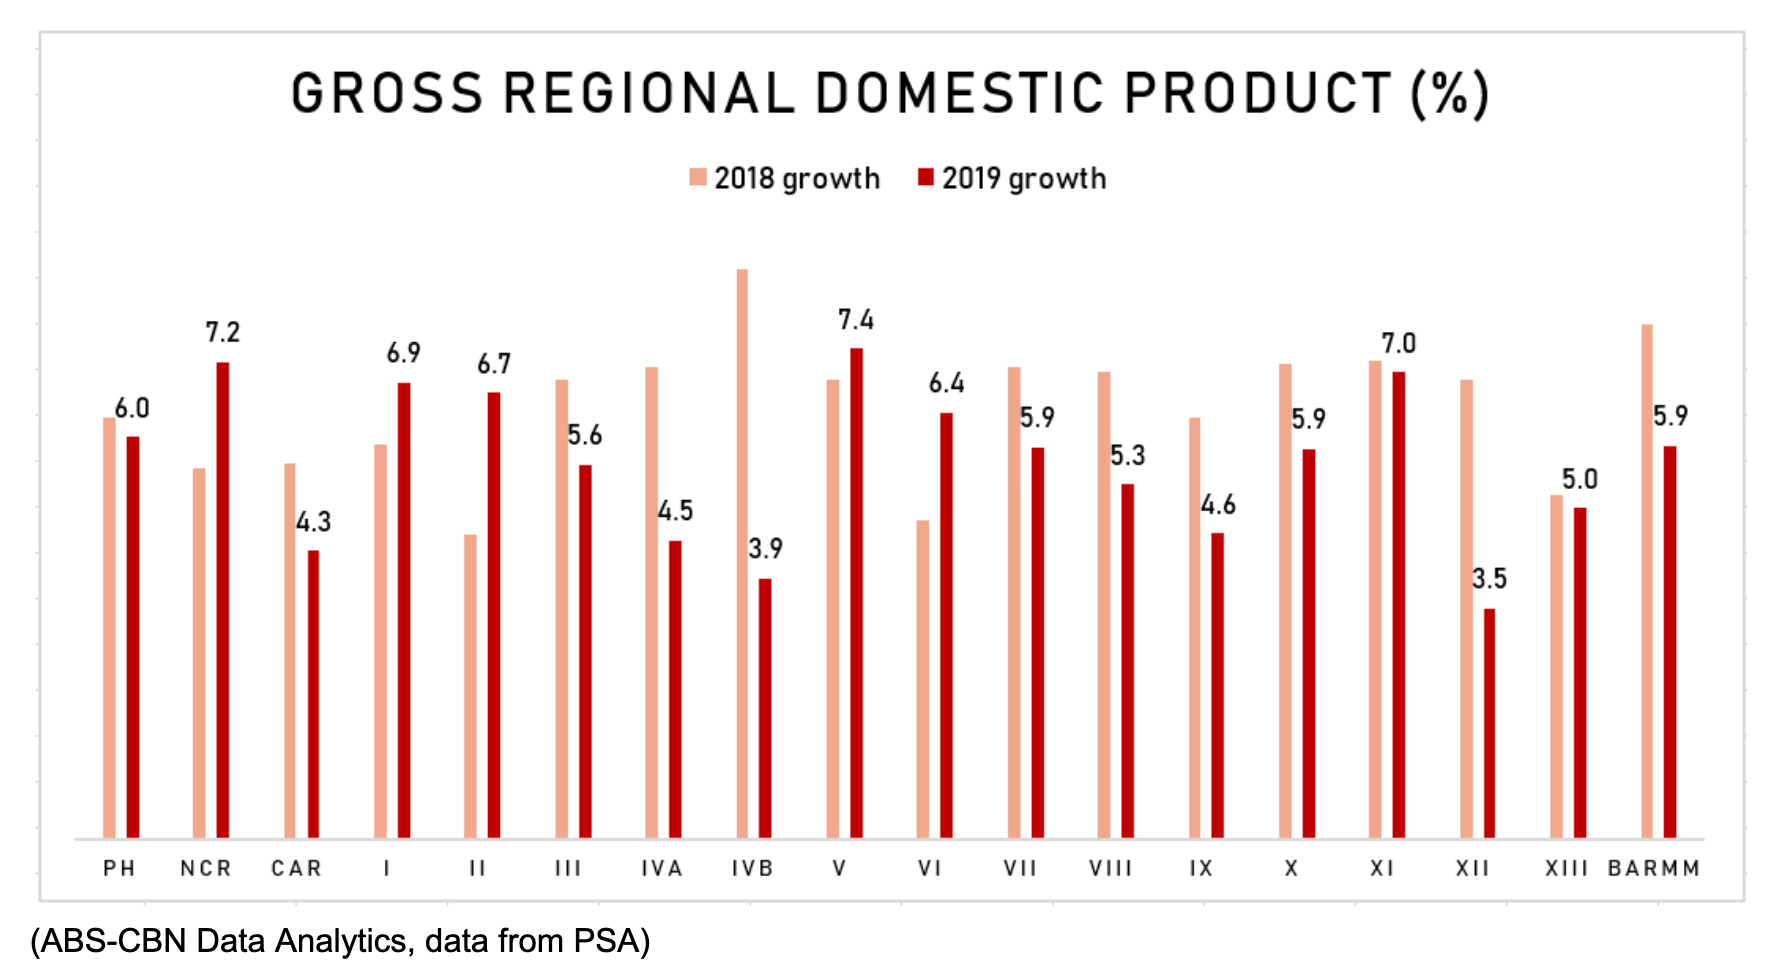
This chart prepared by the ABS-CBN Data Analytics team compares Regional GDP in 2018 and 2019. The region with the highest growth last year was Bicol, or Region 5. It grew 7.4 percent, leading 5 total regions that did better compared to 2018. Four of those regions were located in Luzon, including the National Capital Region, which grew 7.2 percent. Region 4B (MIMAROPA) grew the fastest in 2018 at 8.6 percent, but it had the second lowest growth rate last year at 3.9 percent. All regions grew last year.
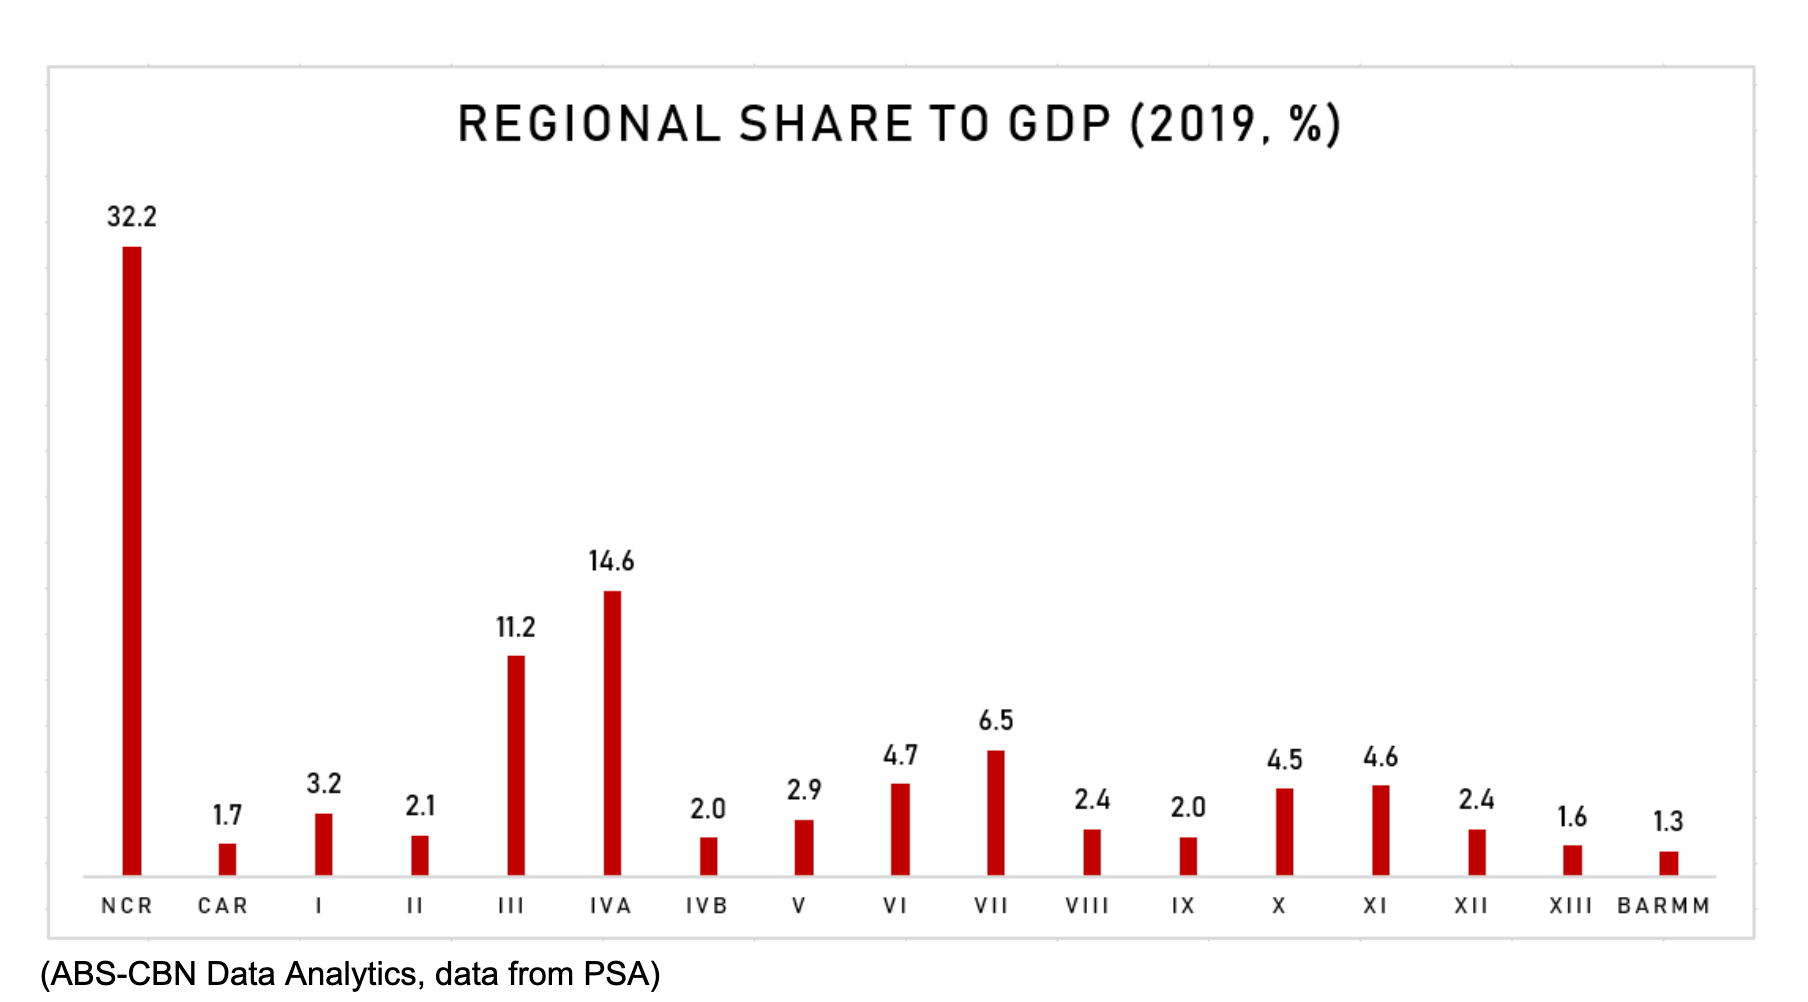
This chart shows us each region’s share or contribution to GDP in 2019. The National Capital Region, Central Luzon or Region 3, and CALABARZON or Region 4A dominate this category, accounting for nearly 60 percent of all economic output last year.
This has been consistent for years now and highlights how centralized the Philippine economy is. The next biggest contributor was again Central Visayas, or Region 7, with a share of 6.5 percent. Together, these regions make up two-thirds of the Philippine economy. They also share another similarity. Those four regions had the highest confirmed COVID-19 cases in the country. The concentration of economic activity in those areas explains why COVID-19 lockdowns caused the biggest quarterly contraction ever recorded. A more equitable distribution of the economy could have averted this.
ADVERTISEMENT
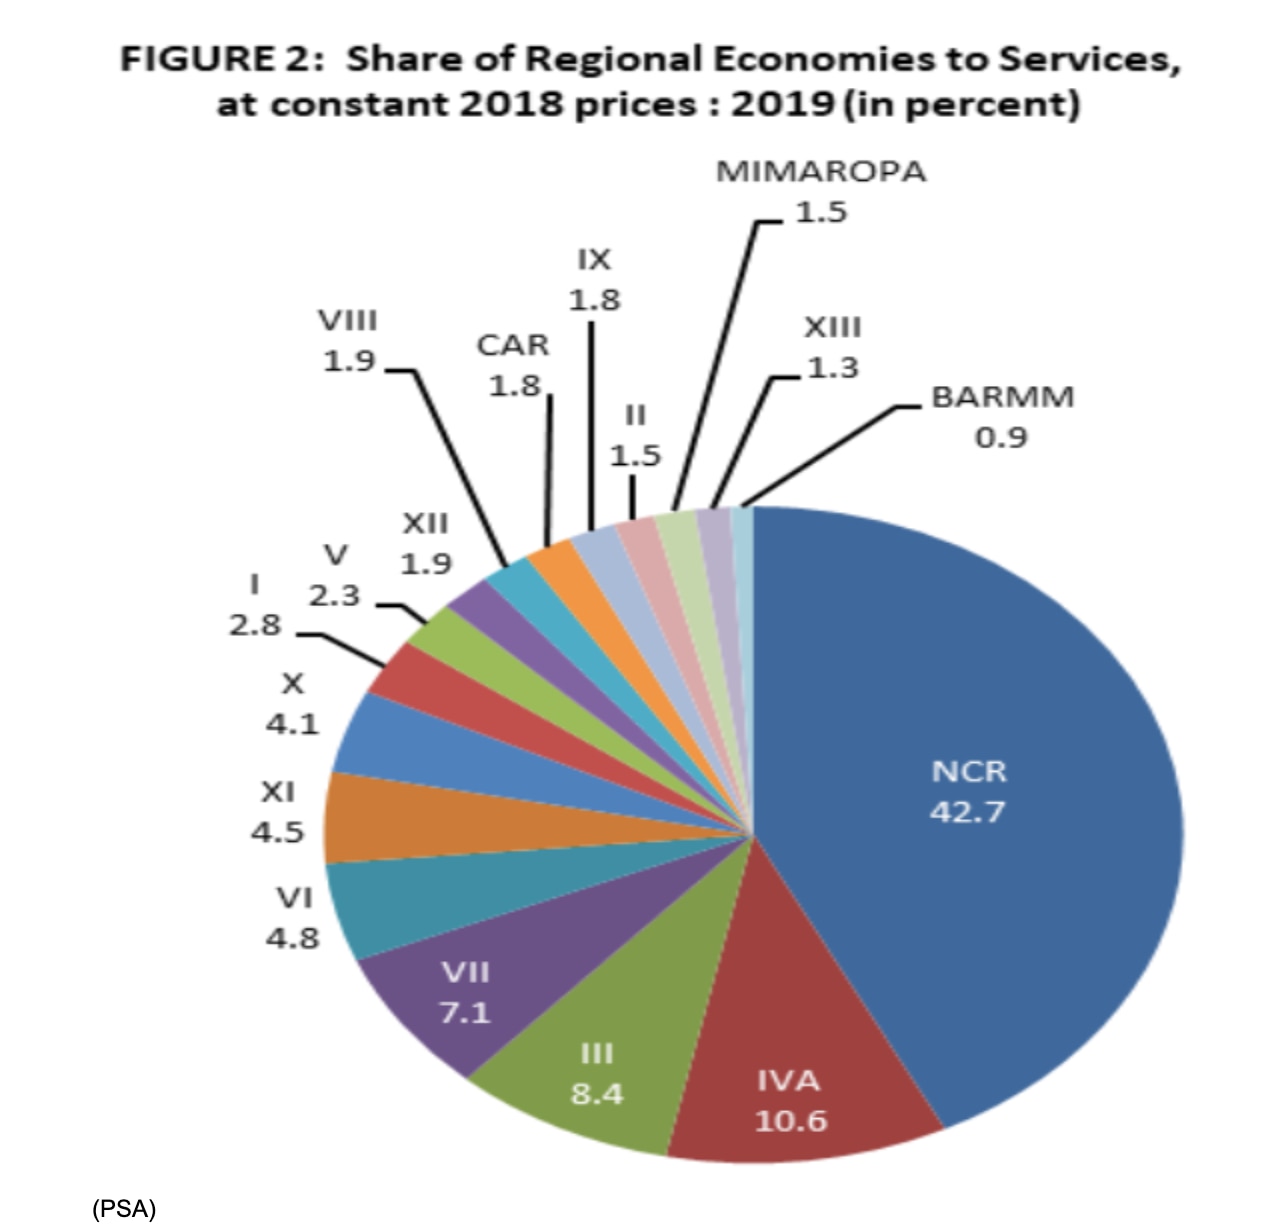
This pie chart by the PSA shows the share of each region to services. The National Capital Region eats up two-fifths of the pie. Services is the biggest employer in the Philippines, providing high paying jobs in sectors such as Business Process Outsourcing. It also includes hospitality, transportation, media, healthcare and finance. They naturally congregate near centers of population. Some of these industries, such as information technology, require the superior connectivity afforded by more developed regions like NCR or CALABARZON.
COVID-19 lockdowns have forced some of the industries in this sector to adopt work from home setups, and the BPO sector in particular have found it can be a viable option, provided connectivity is there. The rapid digitalization of the rest of the Philippines could finally distribute more services to other parts of the country, if the government can provide the infrastructure required. The Department of Information and Communications Technology however says it isn’t getting the funding it needs to do this.
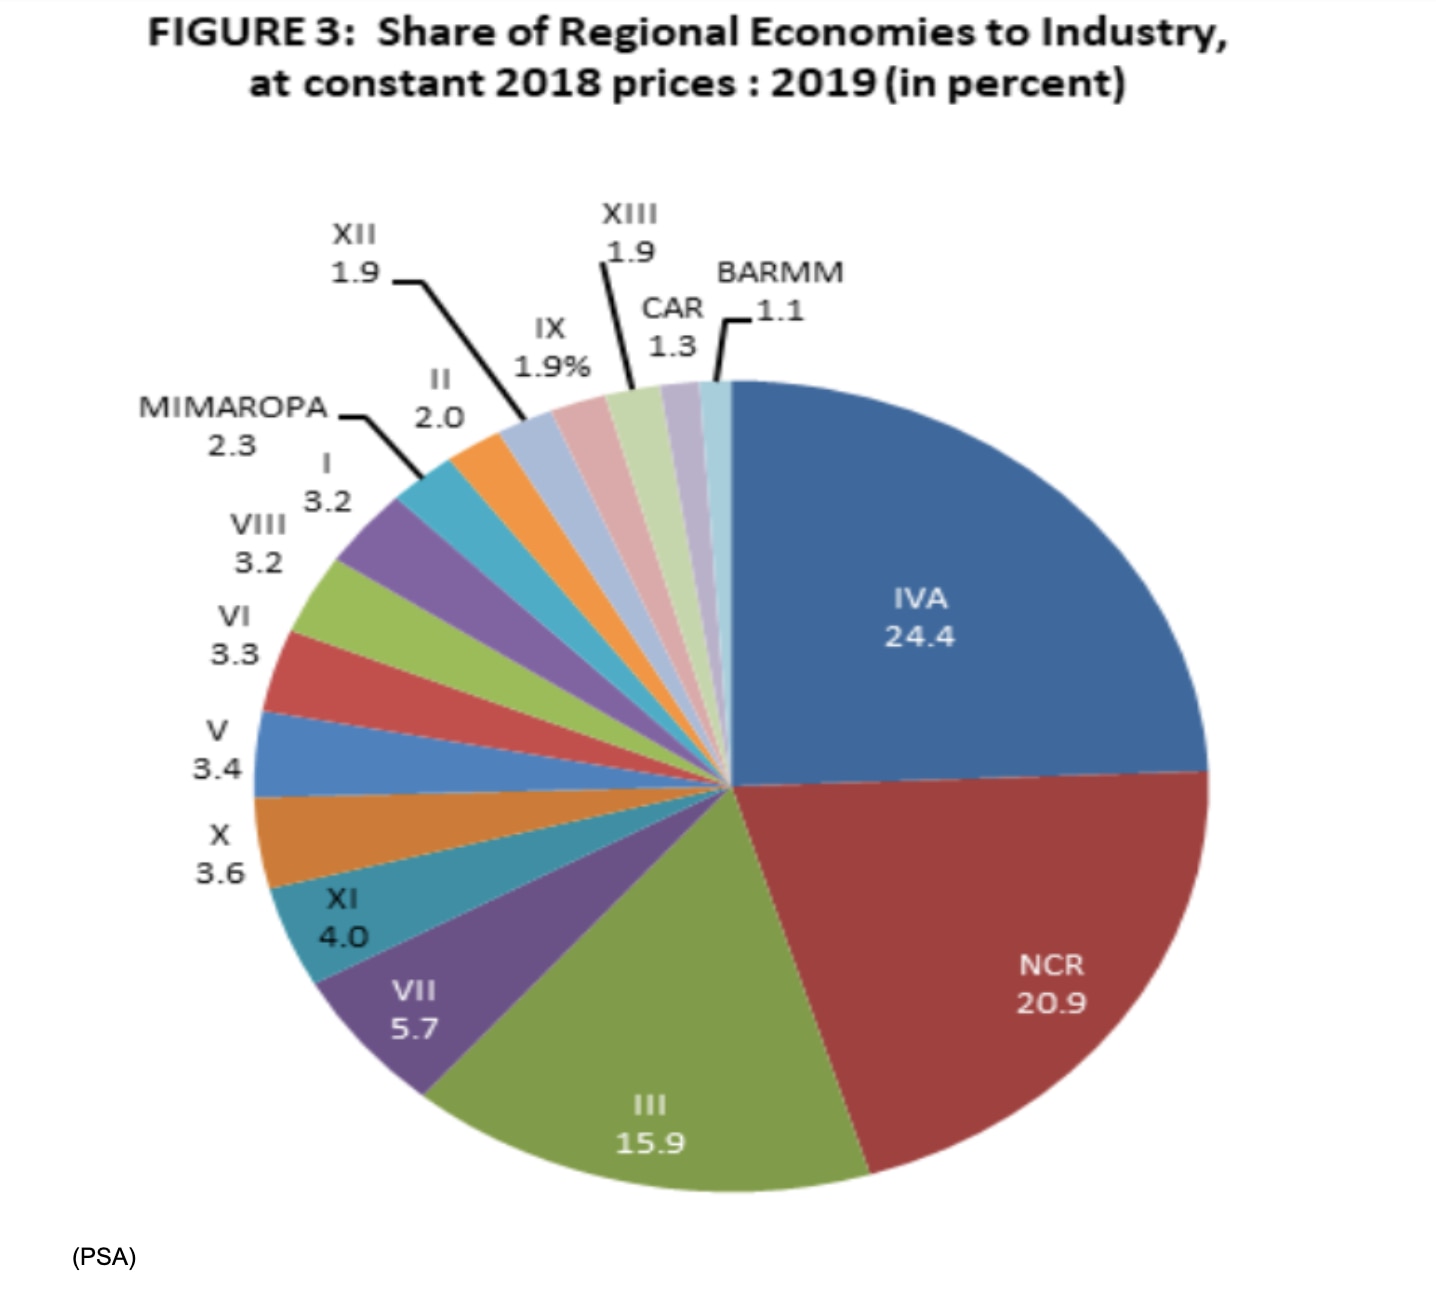
This pie chart from the PSA shows us the regional contributions to industry. Manufacturing requires more land and very specialized logistics infrastructure. This is why such operations usually set up around key ports and transport facilities, as well as sources of raw materials.
The pie chart shows a better distribution, but again, only three regions figure prominently, taking up more than 60 percent of the whole. These are NCR, CALABARZON, and Central Luzon. For these industries to be better distributed, more transport infrastructure is needed in the rest of the Philippines.
The Department of Public Works and Highways, and the Department of Transportation are getting huge budgets for this purpose. But there are other roadblocks to their progress, headlined by corruption and red tape.
This PSA chart shows us each region’s contribution to agriculture. This is the most diversified sector in the Philippines, with nearly all regions contributing. Even the Bangsamoro Autonomous Region in Muslim Mindanao, which contributed the least to total GDP last year at 1.3 percent, contributed nearly 5 percent to total farm output in 2019.
That is better than seven other regions. This chart shows us why some politicians and advocate groups want more investment for farming. Direct investment in agriculture can benefit all of the Philippines regions, from the rice granary of the Philippines in Central Luzon, to the terraces of the Cordillera Administrative Region. Only NCR does not contribute to agriculture, and that could actually change considering new research in urban farming.
Sadly, agriculture contributes far less to total GDP compared to services and industries. The Philippine government has resorted to importation to address supply problems, and it is still struggling with finding the right policy to boost the income of farmers nationwide.
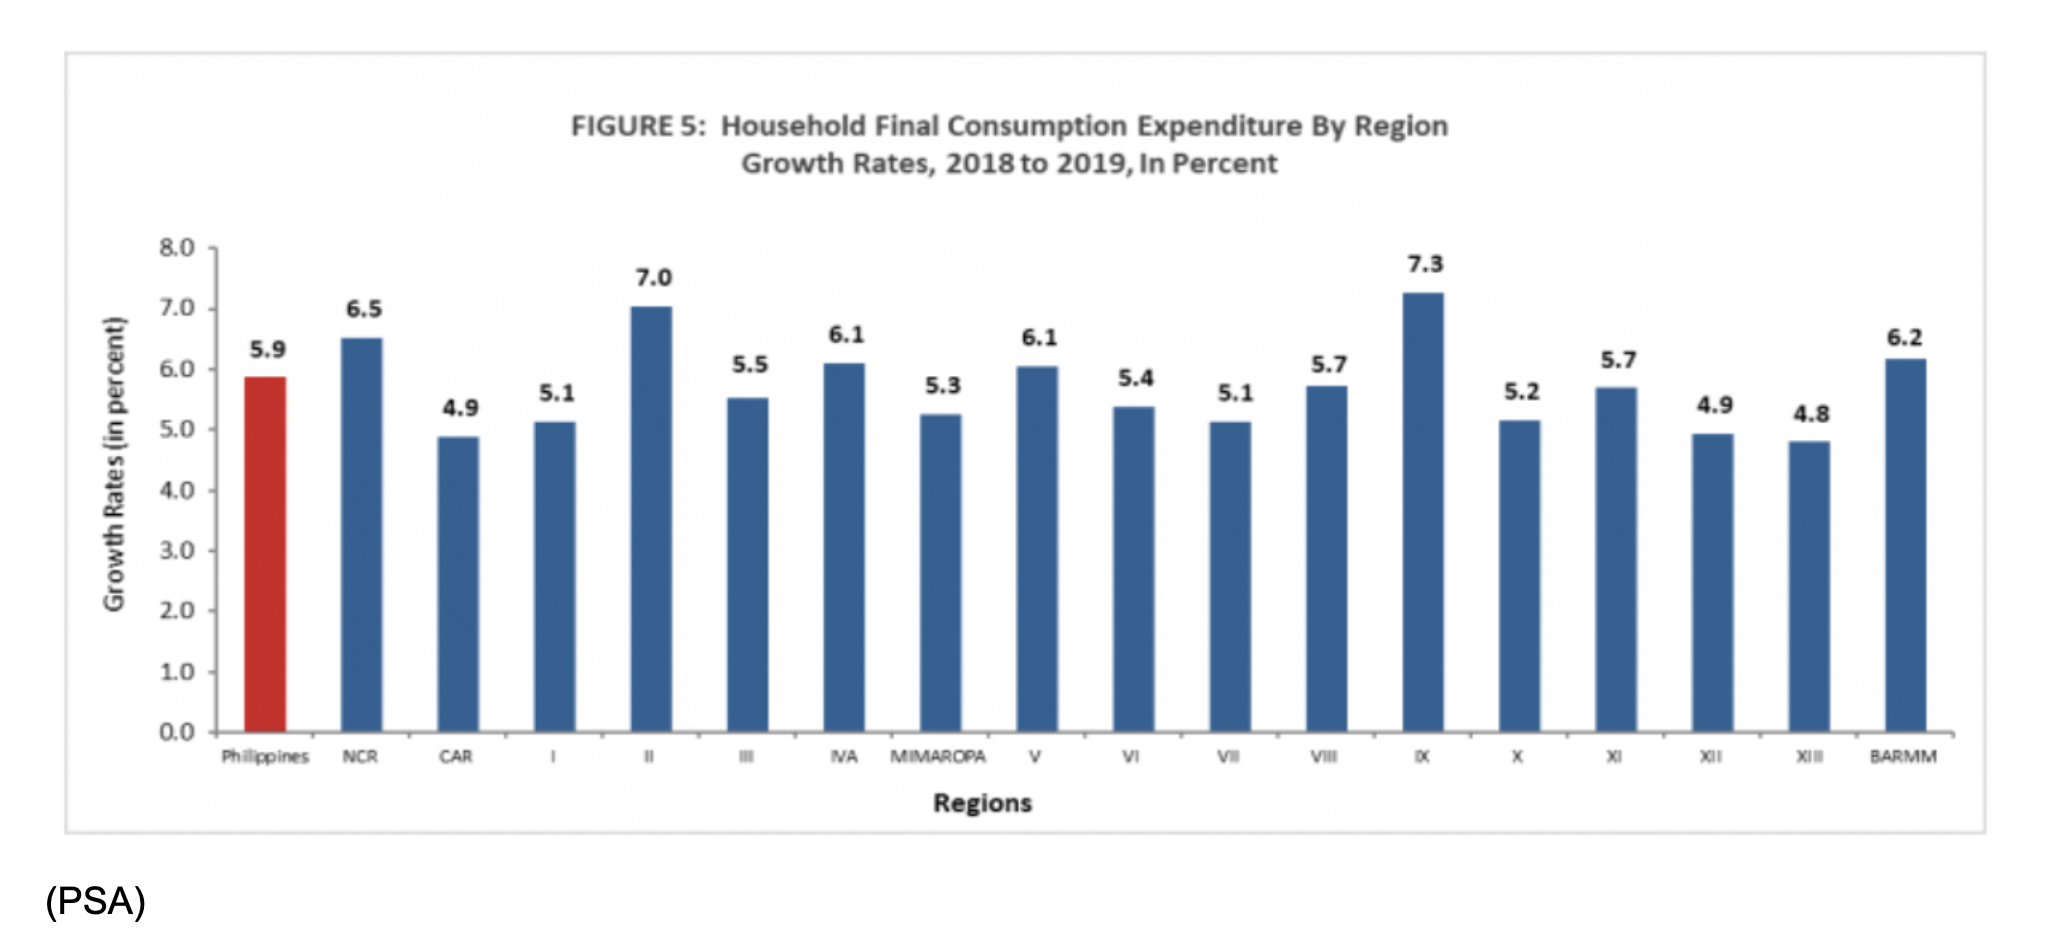
This chart shows the growth in consumption in households, the main driver of the economy. Region 9 or the Zamboanga Peninsula led the way in 2019 with a growth of 7.3 percent. Region 2 or Cagayan Valley came in second at 7.0 percent.
The national average was 5.9 percent. Region 13 or Caraga in Mindanao had the worst growth rate at 4.8 percent, followed by SOCCSKSARGEN and CAR at 4.9 percent. SOCCSKSARGEN had a GDP growth rate of 3.5 percent in 2019, the worst in the Philippines, while CAR grew 4.3 percent.
Caraga had a GDP growth rate of 5.0 percent, a full percentage point below the national average of 6.0 percent. Household consumption matters.
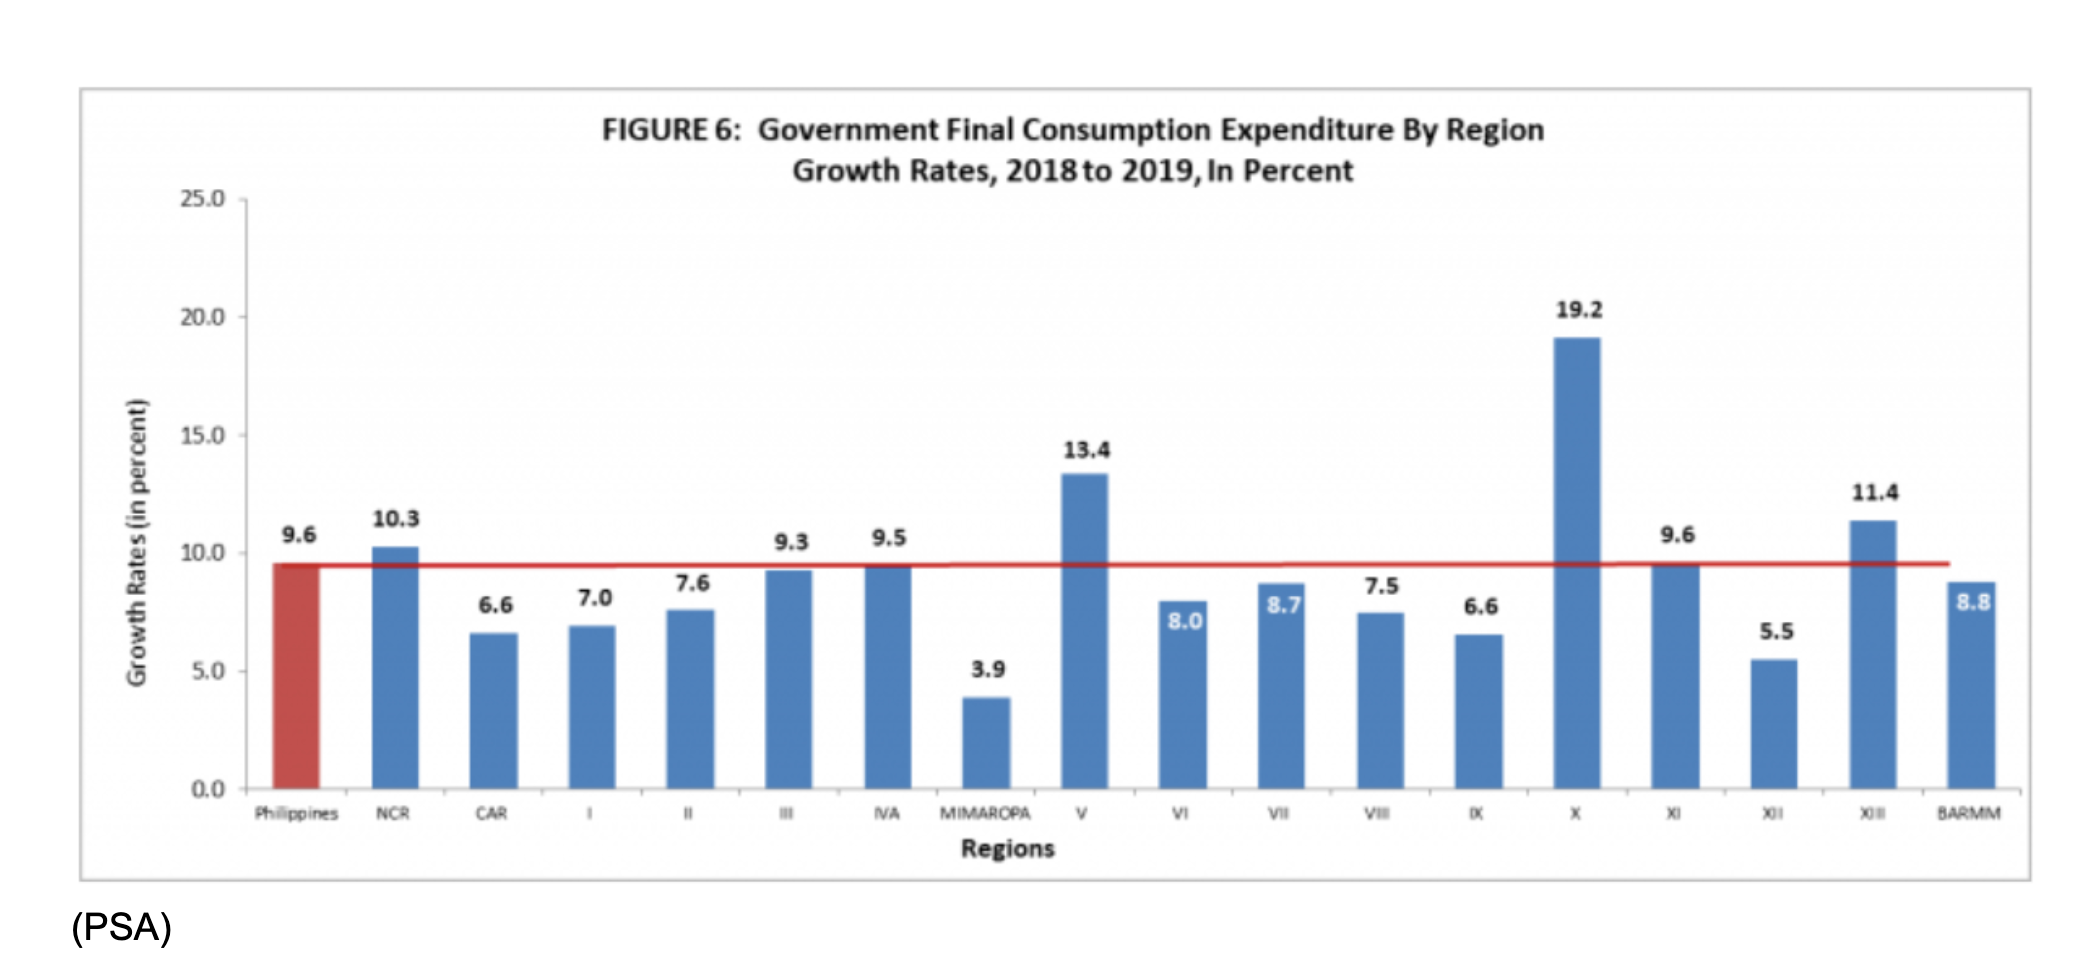
Government spending growth meanwhile outperformed in four regions, which saw a faster increase in government allocations compared to the national average of 9.6 percent. Region 10, or Northern Mindanao, saw government spending there grow by nearly 20 percent.
Region 5, or Bicol, saw a growth of 13.4 percent. Bicol also had an above average growth in household consumption, helping it to a 7.4 percent GDP growth in 2019, best in the Philippines. The remaining regions with higher than average growth in government spending are Caraga and NCR.
MIMAROPA on the other hand saw its government spending grow by just 3.9 percent, worst in the Philippines. This contributed to the drop in its GDP growth from a country best 8.6 percent in 2018, to 3.9 percent in 2019.
When compared, growth in household consumption is more robust and equitably distributed compared to government consumption which was uneven and inconsistent last year. A lot of that has to do with how the national budget was handled.
This chart summarizes why all of this matters. Real per capita GDP growth measures the real income growth of each person in each region. Without going into the details, the chart already shows us how much of a disparity there is in income growth per capita across the different regions.
Some of these regions are already poor to begin with, such as BARMM, and its per capita growth rate was still below the national average in 2019 of 4.5 percent. Meanwhile the richest region, NCR, saw its per capita growth rate exceed the national average by 1.3 percentage points.
A combination of uneven distribution of services and industry, a lack of support for agriculture, and uneven government spending has contributed to this inequitable distribution of wealth. This has also made the Philippines more vulnerable to the negative effects of a pandemic such as the COVID-19 outbreak being experienced now. No doubt the disparity in income growth in 2020’s numbers, to be released around this time in 2021, will bear this out.
ABS-CBN is the leading media and entertainment company in the Philippines, offering quality content across TV, radio, digital, and film. Committed to public service and promoting Filipino values, ABS-CBN continues to inspire and connect audiences worldwide.
Our website is made possible by displaying online
advertisements to our visitors. Please consider supporting
us by disabling your ad blocker on our website.
Our website is made possible by displaying online
advertisements to our visitors. Please consider supporting
us by disabling your ad blocker on our website.