How long should quarantine last? Local online tool could provide more precise answer | ABS-CBN

Welcome, Kapamilya! We use cookies to improve your browsing experience. Continuing to use this site means you agree to our use of cookies. Tell me more!
How long should quarantine last? Local online tool could provide more precise answer
How long should quarantine last? Local online tool could provide more precise answer
Kristine Sabillo,
ABS-CBN News
Published Apr 11, 2020 05:56 AM PHT
MANILA — Developing “disease models,” or projections for the spread of COVID-19, in the Philippines may sound daunting for anyone who is not from the field of science.
MANILA — Developing “disease models,” or projections for the spread of COVID-19, in the Philippines may sound daunting for anyone who is not from the field of science.
At the start of the Luzon lockdown, scientists released various models in an attempt to predict when the outbreak would likely peak in the country.
At the start of the Luzon lockdown, scientists released various models in an attempt to predict when the outbreak would likely peak in the country.
To make such projections easier and more location-specific, government and academic institutions came up with a web-based “disease surveillance platform” that would allow even policymakers and local government units to make their own models.
To make such projections easier and more location-specific, government and academic institutions came up with a web-based “disease surveillance platform” that would allow even policymakers and local government units to make their own models.
Dubbed the Feasibility Analysis of Syndromic Surveillance using Spatio-Temporal Epidemiological Modeler (FASSSTER), the online tool uses data on COVID-19 to help government decision-makers understand the outbreak on national, regional and local levels. It can also assess the effects of different preventive measures.
Dubbed the Feasibility Analysis of Syndromic Surveillance using Spatio-Temporal Epidemiological Modeler (FASSSTER), the online tool uses data on COVID-19 to help government decision-makers understand the outbreak on national, regional and local levels. It can also assess the effects of different preventive measures.
ADVERTISEMENT
Funded by the Department of Science and Technology-Philippine Council for Health Research and Development (DOST-PCHRD), FASSSTER was developed by the Ateneo Center for Computing Competency and Research (ACCCRe) at Ateneo de Manila University in collaboration with University of the Philippines Manila National Telehealth Center (UP-NTHC) and the Department of Health Epidemiology Bureau.
Funded by the Department of Science and Technology-Philippine Council for Health Research and Development (DOST-PCHRD), FASSSTER was developed by the Ateneo Center for Computing Competency and Research (ACCCRe) at Ateneo de Manila University in collaboration with University of the Philippines Manila National Telehealth Center (UP-NTHC) and the Department of Health Epidemiology Bureau.
WHO CAN USE IT
It can accessed through this link by local government units and other government decision-makers.
It can accessed through this link by local government units and other government decision-makers.
“FASSSTER dashboard generates disease models that enable users to project the effect of interventions such as community quarantine, social distancing, and optimal testing on the total number of confirmed cases, deaths, and recoveries over time,” the DOST-PCHRD said in a statement.
“FASSSTER dashboard generates disease models that enable users to project the effect of interventions such as community quarantine, social distancing, and optimal testing on the total number of confirmed cases, deaths, and recoveries over time,” the DOST-PCHRD said in a statement.
The same tool was used by government in considering the extension of the enhanced community quarantine until April 30.
The same tool was used by government in considering the extension of the enhanced community quarantine until April 30.
FASSSTER includes an SMS-based application that lets people report COVID-19 related symptoms to local health authorities.
FASSSTER includes an SMS-based application that lets people report COVID-19 related symptoms to local health authorities.
Those reports are then forwarded to the LGU’s FASSSTER dashboard to help in contact tracing.
Those reports are then forwarded to the LGU’s FASSSTER dashboard to help in contact tracing.
EXISTING PROJECTIONS
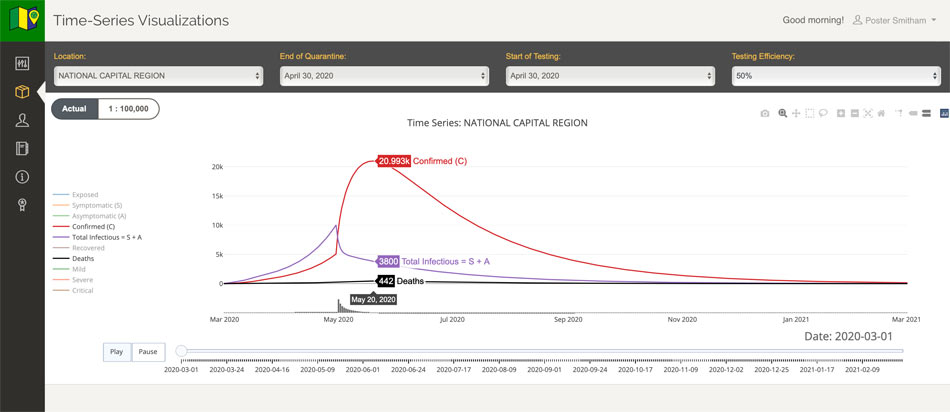
According to the PCHRD, the program is able to estimate the number of confirmed COVID-19 cases in Metro Manila.
According to the PCHRD, the program is able to estimate the number of confirmed COVID-19 cases in Metro Manila.
It was able to predict the peak dates of the outbreak for four scenarios:
It was able to predict the peak dates of the outbreak for four scenarios:
- No enhanced community quarantine (ECQ): Peak on May 30 with 2 million cases
- Lifting of ECQ on April 14 with increased health capacity by 25%: Peak on July 31 with 1.5 million cases
- Lifting of ECQ on April 14 with increased health capacity by 50%: Peak on May 4 with 15,000 cases
- Lifting of ECQ on April 30 with increased health capacity by 75%: Peak on May 21 with 6,800 cases
Increased health capacity refers to more test kits and testing centers and availability of health facilities, health workers and other resources.
Increased health capacity refers to more test kits and testing centers and availability of health facilities, health workers and other resources.
Peak date, or the day when the highest number of cases is recorded, “is an important factor for epidemiologists in assessing the spread of the virus, an epidemic starts to decline after the peak date,” the PCHRD said.
Peak date, or the day when the highest number of cases is recorded, “is an important factor for epidemiologists in assessing the spread of the virus, an epidemic starts to decline after the peak date,” the PCHRD said.
The goal is to “flatten the curve,” or curb the spread of the disease before the health sector is “overburdened with positive cases.”
The goal is to “flatten the curve,” or curb the spread of the disease before the health sector is “overburdened with positive cases.”
According to the DOST-PCHRD, the projections allowed the government to approve the extension of the lockdown “to provide ample time for the different agencies to strengthen the capacity of the health system against the pandemic.”
According to the DOST-PCHRD, the projections allowed the government to approve the extension of the lockdown “to provide ample time for the different agencies to strengthen the capacity of the health system against the pandemic.”
“It also highlighted the need to increase the number of quarantine facilities, implement stronger healthcare programs and regular assessment of health capacities,” the agency added.
“It also highlighted the need to increase the number of quarantine facilities, implement stronger healthcare programs and regular assessment of health capacities,” the agency added.
HOW IT WORKS
Besides projecting peak dates, FASSSTER can also estimate the number of individuals who will be exposed to the virus, and who will be symptomatic and asymptomatic. Recoveries, deaths and even mild, severe and critical cases can be projected, too.
Besides projecting peak dates, FASSSTER can also estimate the number of individuals who will be exposed to the virus, and who will be symptomatic and asymptomatic. Recoveries, deaths and even mild, severe and critical cases can be projected, too.
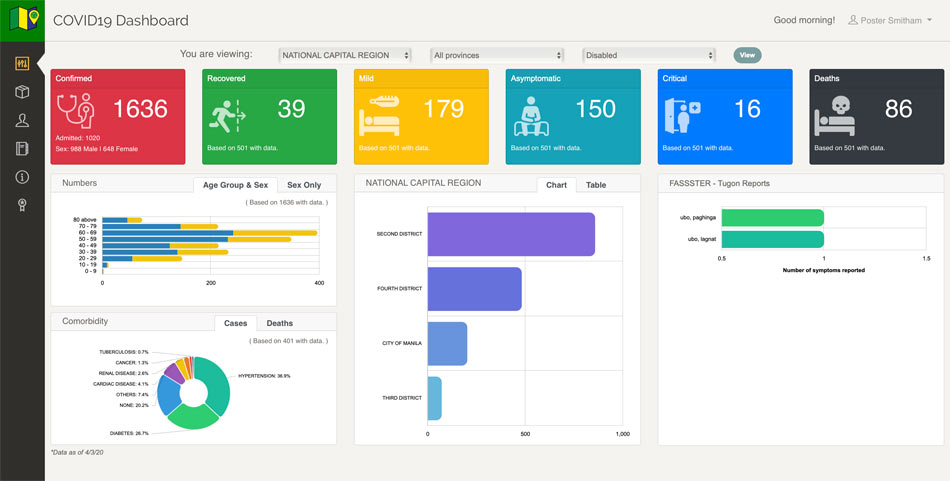
A screenshot of the dashboard also shows graphs of the age group and sex of potential cases, as well as comorbidity, or pre-existing conditions of patients.
A screenshot of the dashboard also shows graphs of the age group and sex of potential cases, as well as comorbidity, or pre-existing conditions of patients.
Based on existing cases, there are more male and elderly patients who experience severe COVID-19 symptoms. A majority of the fatalities also have pre-existing conditions.
Based on existing cases, there are more male and elderly patients who experience severe COVID-19 symptoms. A majority of the fatalities also have pre-existing conditions.
The data it uses for the models are from the DOH’s Epidemiology Bureau.
The data it uses for the models are from the DOH’s Epidemiology Bureau.
The DOST-PCHRD said the models will continue to be updated as new data are fed into the application. It also emphasized the need to make decisions driven by science.
The DOST-PCHRD said the models will continue to be updated as new data are fed into the application. It also emphasized the need to make decisions driven by science.
Read More:
COVID-19
coronavirus
Department of Science and Technology
disease modeling
flattening the curve
disease projection
COVID-19 projection
ADVERTISEMENT
ADVERTISEMENT


